STA 235H - Multiple Regression: Interactions & Nonlinearity
Fall 2023
McCombs School of Business, UT Austin
Before we start...
Use the knowledge check portion of the JITT to assess your own understanding:
Be sure to answer the question correctly (look at the feedback provided)
Feedback are guidelines; Try to use your own words.
Before we start...
Use the knowledge check portion of the JITT to assess your own understanding:
Be sure to answer the question correctly (look at the feedback provided)
Feedback are guidelines; Try to use your own words.
If you are struggling with material covered in STA 301H: Check the course website for resources and come to Office Hours.
Office Hours Prof. Bennett: Wed 10.30-11.30am and Thu 4.00-5.30pm
No in-person class next week -- Recorded class
Today
Quick multiple regression review:
- Interpreting coefficients
- Interaction models
Looking at your data:
- Distributions
Nonlinear models:
- Logarithmic outcomes
- Polynomial terms

Remember last week's example? The Bechdel Test
Three criteria:
- At least two named women
- Who talk to each other
- About something besides a man

Is it convenient for my movie to pass the Bechdel test?
lm(Adj_Revenue ~ bechdel_test + Adj_Budget + Metascore + imdbRating, data=bechdel)## Estimate Std. Error t value Pr(>|t|)## (Intercept) -127.0710 17.0563 -7.4501 0.0000## bechdel_test 11.0009 4.3786 2.5124 0.0121## Adj_Budget 1.1192 0.0367 30.4866 0.0000## Metascore 7.0254 1.9058 3.6864 0.0002## imdbRating 15.4631 3.3914 4.5595 0.0000What does each column represent?
Is it convenient for my movie to pass the Bechdel test?
lm(Adj_Revenue ~ bechdel_test + Adj_Budget + Metascore + imdbRating, data=bechdel)## Estimate Std. Error t value Pr(>|t|)## (Intercept) -127.0710 17.0563 -7.4501 0.0000## bechdel_test 11.0009 4.3786 2.5124 0.0121## Adj_Budget 1.1192 0.0367 30.4866 0.0000## Metascore 7.0254 1.9058 3.6864 0.0002## imdbRating 15.4631 3.3914 4.5595 0.0000- "Estimate": Point estimates of our paramters β. We call them ^β.
Is it convenient for my movie to pass the Bechdel test?
lm(Adj_Revenue ~ bechdel_test + Adj_Budget + Metascore + imdbRating, data=bechdel)## Estimate Std. Error t value Pr(>|t|)## (Intercept) -127.0710 17.0563 -7.4501 0.0000## bechdel_test 11.0009 4.3786 2.5124 0.0121## Adj_Budget 1.1192 0.0367 30.4866 0.0000## Metascore 7.0254 1.9058 3.6864 0.0002## imdbRating 15.4631 3.3914 4.5595 0.0000"Estimate": Point estimates of our paramters β. We call them ^β.
"Standard Error" (SE): You can think about it as the variability of ^β. The smaller, the more precise ^β is!
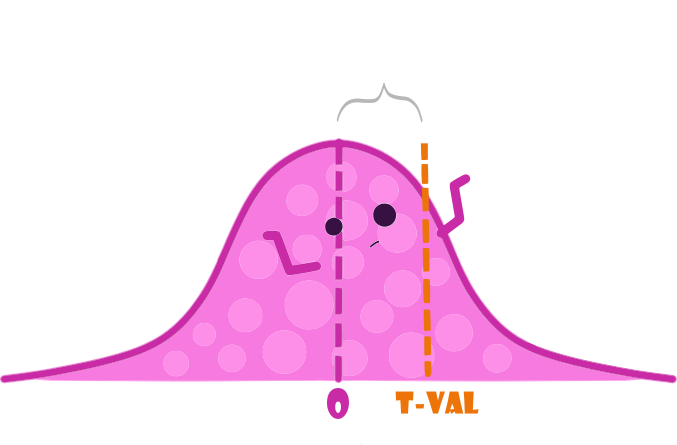
"t-value": A value of the Student distribution that measures how many SE away ^β is from 0. You can calculate it as tval=^βSE. It relates to our null-hypothesis H0:β=0.
"p-value": Probability of rejecting the null hypothesis and being wrong (Type I error). You want this to be a small as possible (statistically significant).
Reminder: Null-Hypothesis
We are testing H0:β=0 vs H1:β≠0
- "Reject the null hypothesis"

- "Not reject the null hypothesis"

Note: Figures adapted from @AllisonHorst's art
Reminder: Null-Hypothesis
Reject the null if the t-value falls outside the dashed lines.

Note: Figures adapted from @AllisonHorst's art
One extra dollar in our budget
- Imagine now that you have an hypothesis that Bechdel movies also get more bang for their buck, e.g. they get more revenue for an additional dollar in their budget.
How would you test that in an equation?
One extra dollar in our budget
- Imagine now that you have an hypothesis that Bechdel movies also get more bang for their buck, e.g. they get more revenue for an additional dollar in their budget.
How would you test that in an equation?
Interactions!
One extra dollar in our budget
Interaction model:
Revenue=β0+β1Bechdel+β3Budget+β6(Budget×Bechdel)+β4IMDB+β5MetaScore+ε
One extra dollar in our budget
Interaction model:
Revenue=β0+β1Bechdel+β3Budget+β6(Budget×Bechdel)+β4IMDB+β5MetaScore+ε How should we think about this?
- Write the equation for a movie that does not pass the Bechdel test. How does it look like?
One extra dollar in our budget
Interaction model:
Revenue=β0+β1Bechdel+β3Budget+β6(Budget×Bechdel)+β4IMDB+β5MetaScore+ε How should we think about this?
Write the equation for a movie that does not pass the Bechdel test. How does it look like?
Now do the same for a movie that passes the Bechdel test. How does it look like?
One extra dollar in our budget
Now, let's interpret some coefficients:
If Bechdel=0, then:
Revenue=β0+β3Budget+β4IMDB+β5MetaScore+ε
One extra dollar in our budget
Now, let's interpret some coefficients:
If Bechdel=0, then:
Revenue=β0+β3Budget+β4IMDB+β5MetaScore+ε
- If Bechdel=1, then:
Revenue=(β0+β1)+(β3+β6)Budget+β4IMDB+β5MetaScore+ε
One extra dollar in our budget
Now, let's interpret some coefficients:
If Bechdel=0, then:
Revenue=β0+β3Budget+β4IMDB+β5MetaScore+ε
- If Bechdel=1, then:
Revenue=(β0+β1)+(β3+β6)Budget+β4IMDB+β5MetaScore+ε
- What is the difference in the association between budget and revenue for movies that pass the Bechdel test vs. those that don't?
Let's put some data into it
lm(Adj_Revenue ~ bechdel_test*Adj_Budget + Metascore + imdbRating, data=bechdel)## Estimate Std. Error t value Pr(>|t|)## (Intercept) -124.1997 17.4932 -7.0999 0.0000## bechdel_test 7.5138 6.4257 1.1693 0.2425## Adj_Budget 1.0926 0.0513 21.2865 0.0000## Metascore 7.1424 1.9126 3.7344 0.0002## imdbRating 15.2268 3.4069 4.4694 0.0000## bechdel_test:Adj_Budget 0.0546 0.0737 0.7416 0.4585Let's put some data into it
lm(Adj_Revenue ~ bechdel_test*Adj_Budget + Metascore + imdbRating, data=bechdel)## Estimate Std. Error t value Pr(>|t|)## (Intercept) -124.1997 17.4932 -7.0999 0.0000## bechdel_test 7.5138 6.4257 1.1693 0.2425## Adj_Budget 1.0926 0.0513 21.2865 0.0000## Metascore 7.1424 1.9126 3.7344 0.0002## imdbRating 15.2268 3.4069 4.4694 0.0000## bechdel_test:Adj_Budget 0.0546 0.0737 0.7416 0.4585What is the association between budget and revenue for movies that pass the Bechdel test?
What is the difference in the association between budget and revenue for movies that pass vs movies that don't pass the Bechdel test?
Let's put some data into it
lm(Adj_Revenue ~ bechdel_test*Adj_Budget + Metascore + imdbRating, data=bechdel)## Estimate Std. Error t value Pr(>|t|)## (Intercept) -124.1997 17.4932 -7.0999 0.0000## bechdel_test 7.5138 6.4257 1.1693 0.2425## Adj_Budget 1.0926 0.0513 21.2865 0.0000## Metascore 7.1424 1.9126 3.7344 0.0002## imdbRating 15.2268 3.4069 4.4694 0.0000## bechdel_test:Adj_Budget 0.0546 0.0737 0.7416 0.4585What is the association between budget and revenue for movies that pass the Bechdel test?
What is the difference in the association between budget and revenue for movies that pass vs movies that don't pass the Bechdel test?
Is that difference statistically significant (at conventional levels)?
Let's look at another example
Cars, cars, cars
- Used cars in South California (from this week's JITT)
cars <- read.csv("https://raw.githubusercontent.com/maibennett/sta235/main/exampleSite/content/Classes/Week2/1_OLS/data/SoCalCars.csv", stringsAsFactors = FALSE)names(cars)## [1] "type" "certified" "body" "make" "model" "trim" ## [7] "mileage" "price" "year" "dealer" "city" "rating" ## [13] "reviews" "badge"Data source: "Modern Business Analytics" (Taddy, Hendrix, & Harding, 2018)
Luxury vs. non-luxury cars?
Do you think there's a difference between how price changes over time for luxury vs non-luxury cars?
Luxury vs. non-luxury cars?
Do you think there's a difference between how price changes over time for luxury vs non-luxury cars?
How would you test this?
Let's go to R
Models with interactions
- You include the interaction between two (or more) covariates:
ˆPrice=β0+^β1Rating+^β2Miles+^β3Luxury+^β4Year+^β5Luxury×Year
Models with interactions
- You include the interaction between two (or more) covariates:
ˆPrice=β0+^β1Rating+^β2Miles+^β3Luxury+^β4Year+^β5Luxury×Year
- ^β3 and ^β4 are considered the main effects (no interaction)
Models with interactions
- You include the interaction between two (or more) covariates:
ˆPrice=β0+^β1Rating+^β2Miles+^β3Luxury+^β4Year+^β5Luxury×Year
- ^β3 and ^β4 are considered the main effects (no interaction)
The coefficient you are interested in is ^β5:
- Difference in the price change for one additional year between luxury vs non-luxury cars, holding other variables constant.
Now it's your turn
- Looking at this equation:
ˆPrice=β0+^β1Rating+^β2Miles+^β3Luxury+^β4Year+^β5Luxury×Year 1) What is the association between price and year for non-luxury cars?
Now it's your turn
- Looking at this equation:
ˆPrice=β0+^β1Rating+^β2Miles+^β3Luxury+^β4Year+^β5Luxury×Year 1) What is the association between price and year for non-luxury cars?
2) What is the association between price and year for luxury cars?
Looking at our data
- We have dived into running models head on. Is that a good idea?
Looking at our data
- We have dived into running models head on. Is that a good idea?

What should we do before we ran any model?
Inspect your data!
Some ideas:
- Use
vtable:
library(vtable)vtable(cars)Some ideas:
- Use
vtable:
library(vtable)vtable(cars)- Use
summaryto see the min, max, mean, and quartile:
cars %>% select(price, mileage, year) %>% summary(.)## price mileage year ## Min. : 1790 Min. : 0 Min. :1966 ## 1st Qu.: 16234 1st Qu.: 5 1st Qu.:2017 ## Median : 23981 Median : 56 Median :2019 ## Mean : 32959 Mean : 21873 Mean :2018 ## 3rd Qu.: 36745 3rd Qu.: 36445 3rd Qu.:2020 ## Max. :1499000 Max. :292952 Max. :2021Some ideas:
- Use
vtable:
library(vtable)vtable(cars)- Use
summaryto see the min, max, mean, and quartile:
cars %>% select(price, mileage, year) %>% summary(.)## price mileage year ## Min. : 1790 Min. : 0 Min. :1966 ## 1st Qu.: 16234 1st Qu.: 5 1st Qu.:2017 ## Median : 23981 Median : 56 Median :2019 ## Mean : 32959 Mean : 21873 Mean :2018 ## 3rd Qu.: 36745 3rd Qu.: 36445 3rd Qu.:2020 ## Max. :1499000 Max. :292952 Max. :2021- Plot your data!
Look at the data
Look at the data
What can you say about this variable?
Logarithms to the rescue?
Logarithms to the rescue?
How would we interpret coefficients now?
- Let's interpret the coefficient for Miles in the following equation:
log(Price)=β0+β1Rating+β2Miles+β3Luxury+β4Year+ε
How would we interpret coefficients now?
- Let's interpret the coefficient for Miles in the following equation:
log(Price)=β0+β1Rating+β2Miles+β3Luxury+β4Year+ε
Remember: β2 represents the average change in the outcome variable, log(Price), for a one-unit increase in the independent variable Miles.
- Think about the units of the dependent and independent variables!
A side note on log-transformed variables...
log(Y)=^β0+^β1X
We want to compare the outcome for a regression with X=x and X=x+1
A side note on log-transformed variables...
log(Y)=^β0+^β1X
We want to compare the outcome for a regression with X=x and X=x+1
log(y0)=^β0+^β1x (1)
and
log(y1)=^β0+^β1(x+1) (2)
A side note on log-transformed variables...
log(Y)=^β0+^β1X
We want to compare the outcome for a regression with X=x and X=x+1
log(y0)=^β0+^β1x (1)
and
log(y1)=^β0+^β1(x+1) (2)
- Let's subtract (2) - (1)!
A side note on log-transformed variables...
log(y1)−log(y0)=^β0+^β1(x+1)−(^β0+^β1x)
A side note on log-transformed variables...
log(y1)−log(y0)=^β0+^β1(x+1)−(^β0+^β1x)
log(y1y0)=^β1
A side note on log-transformed variables...
log(y1)−log(y0)=^β0+^β1(x+1)−(^β0+^β1x)
log(y1y0)=^β1
log(1+y1−y0y0)=^β1
A side note on log-transformed variables...
log(y1)−log(y0)=^β0+^β1(x+1)−(^β0+^β1x)
log(y1y0)=^β1
log(1+y1−y0y0)=^β1
→Δyy=exp(^β1)−1
An important approximation
log(y1)−log(y0)=^β0+^β1(x+1)−(^β0+^β1x)
log(y1y0)=^β1
log(1+y1−y0y0)=^β1
An important approximation
log(y1)−log(y0)=^β0+^β1(x+1)−(^β0+^β1x)
log(y1y0)=^β1
log(1+y1−y0y0)=^β1
≈y1−y0y0=^β1
An important approximation
log(y1)−log(y0)=^β0+^β1(x+1)−(^β0+^β1x)
log(y1y0)=^β1
log(1+y1−y0y0)=^β1
≈y1−y0y0=^β1
→%Δy=100×^β1
How would we interpret coefficients now?
- Let's interpret the coefficient for Miles in the following equation:
log(Price)=β0+β1Rating+β2Miles+β3Luxury+β4Year+ε
How would we interpret coefficients now?
- Let's interpret the coefficient for Miles in the following equation:
log(Price)=β0+β1Rating+β2Miles+β3Luxury+β4Year+ε
- For an additional 1,000 miles (Note: Remember Miles is measured in thousands of miles), the logarithm of the price increases/decreases, on average, by ^β2, holding other variables constant.
How would we interpret coefficients now?
- Let's interpret the coefficient for Miles in the following equation:
log(Price)=β0+β1Rating+β2Miles+β3Luxury+β4Year+ε
For an additional 1,000 miles (Note: Remember Miles is measured in thousands of miles), the logarithm of the price increases/decreases, on average, by ^β2, holding other variables constant.
For an additional 1,000 miles, the price increases/decreases, on average, by 100×^β2%, holding other variables constant.
How would we interpret coefficients now?
summary(lm(log(price) ~ rating + mileage + luxury + year, data = cars))## ## Call:## lm(formula = log(price) ~ rating + mileage + luxury + year, data = cars)## ## Residuals:## Min 1Q Median 3Q Max ## -1.14363 -0.29112 -0.02593 0.26412 2.28855 ## ## Coefficients:## Estimate Std. Error t value Pr(>|t|) ## (Intercept) 2.5105164 0.1518312 16.535 < 2e-16 ***## rating 0.0305782 0.0057680 5.301 1.27e-07 ***## mileage -0.0098628 0.0004327 -22.792 < 2e-16 ***## luxury 0.5517712 0.0228132 24.186 < 2e-16 ***## year 0.0118783 0.0030075 3.950 8.09e-05 ***## ---## Signif. codes: 0 '***' 0.001 '**' 0.01 '*' 0.05 '.' 0.1 ' ' 1## ## Residual standard error: 0.436 on 2083 degrees of freedom## Multiple R-squared: 0.4699, Adjusted R-squared: 0.4689 ## F-statistic: 461.6 on 4 and 2083 DF, p-value: < 2.2e-16Adding polynomial terms
Another way to capture nonlinear associations between the outcome (Y) and covariates (X) is to include polynomial terms:
- e.g. Y=β0+β1X+β2X2+ε
Adding polynomial terms
Another way to capture nonlinear associations between the outcome (Y) and covariates (X) is to include polynomial terms:
- e.g. Y=β0+β1X+β2X2+ε
Let's look at an example!
Determinants of wages: CPS 1985
Determinants of wages: CPS 1985
Experience vs wages: CPS 1985
Experience vs wages: CPS 1985
log(Wage)=β0+β1Educ+β2Exp+ε
Experience vs wages: CPS 1985
log(Wage)=β0+β1Educ+β2Exp+β3Exp2+ε
Mincer equation
log(Wage)=β0+β1Educ+β2Exp+β3Exp2+ε
- Interpret the coefficient for education
Mincer equation
log(Wage)=β0+β1Educ+β2Exp+β3Exp2+ε
- Interpret the coefficient for education
One additional year of education is associated, on average, to ^β1×100% increase in hourly wages, holding experience constant
Mincer equation
log(Wage)=β0+β1Educ+β2Exp+β3Exp2+ε
- Interpret the coefficient for education
One additional year of education is associated, on average, to ^β1×100% increase in hourly wages, holding experience constant
- What is the association between experience and wages?
Interpreting coefficients in quadratic equation
Interpreting coefficients in quadratic equation
Interpreting coefficients in quadratic equation
Interpreting coefficients in quadratic equation
log(Wage)=β0+β1Educ+β2Exp+β3Exp2+ε What is the association between experience and wages?
Interpreting coefficients in quadratic equation
log(Wage)=β0+β1Educ+β2Exp+β3Exp2+ε What is the association between experience and wages?
- Pick a value for Exp0 (e.g. mean, median, one value of interest)
Interpreting coefficients in quadratic equation
log(Wage)=β0+β1Educ+β2Exp+β3Exp2+ε What is the association between experience and wages?
- Pick a value for Exp0 (e.g. mean, median, one value of interest)
Increasing work experience from Exp0 to Exp0+1 years is associated, on average, to a (^β2+2^β3×Exp0)100% increase on hourly wages, holding education constant
Increasing work experience from 20 to 21 years is associated, on average, to a (^β2+2^β3×20)100% increase on hourly wages, holding education constant
Let's put some numbers into it
summary(lm(log(wage) ~ education + experience + I(experience^2), data = CPS1985))## ## Call:## lm(formula = log(wage) ~ education + experience + I(experience^2), ## data = CPS1985)## ## Residuals:## Min 1Q Median 3Q Max ## -2.12709 -0.31543 0.00671 0.31170 1.98418 ## ## Coefficients:## Estimate Std. Error t value Pr(>|t|) ## (Intercept) 0.5203218 0.1236163 4.209 3.01e-05 ***## education 0.0897561 0.0083205 10.787 < 2e-16 ***## experience 0.0349403 0.0056492 6.185 1.24e-09 ***## I(experience^2) -0.0005362 0.0001245 -4.307 1.97e-05 ***## ---## Signif. codes: 0 '***' 0.001 '**' 0.01 '*' 0.05 '.' 0.1 ' ' 1## ## Residual standard error: 0.4619 on 530 degrees of freedom## Multiple R-squared: 0.2382, Adjusted R-squared: 0.2339 ## F-statistic: 55.23 on 3 and 530 DF, p-value: < 2.2e-16Let's put some numbers into it
summary(lm(log(wage) ~ education + experience + I(experience^2), data = CPS1985))## ## Call:## lm(formula = log(wage) ~ education + experience + I(experience^2), ## data = CPS1985)## ## Residuals:## Min 1Q Median 3Q Max ## -2.12709 -0.31543 0.00671 0.31170 1.98418 ## ## Coefficients:## Estimate Std. Error t value Pr(>|t|) ## (Intercept) 0.5203218 0.1236163 4.209 3.01e-05 ***## education 0.0897561 0.0083205 10.787 < 2e-16 ***## experience 0.0349403 0.0056492 6.185 1.24e-09 ***## I(experience^2) -0.0005362 0.0001245 -4.307 1.97e-05 ***## ---## Signif. codes: 0 '***' 0.001 '**' 0.01 '*' 0.05 '.' 0.1 ' ' 1## ## Residual standard error: 0.4619 on 530 degrees of freedom## Multiple R-squared: 0.2382, Adjusted R-squared: 0.2339 ## F-statistic: 55.23 on 3 and 530 DF, p-value: < 2.2e-16- Increasing experience from 20 to 21 years is associated with an average increase in wages of 1.35%, holding education constant.
Main takeaway points
The model you fit depends on what you want to analyze.
Plot your data!
Make sure you capture associations that make sense.

Next week

Issues with regressions and our data:
Outliers?
Heteroskedasticity
Regression models with discrete outcomes:
- Probability linear models
References
Ismay, C. & A. Kim. (2021). “Statistical Inference via Data Science”. Chapter 6 & 10.
Keegan, B. (2018). "The Need for Openess in Data Journalism". Github Repository