STA 235H - Classification and Regression Trees (CART)
Fall 2023
McCombs School of Business, UT Austin
Announcements
- Next week will be the last class with new material.
Announcements
Next week will be the last class with new material.
The final week of class will be for a review session.
- Final Trivia!
Announcements
Next week will be the last class with new material.
The final week of class will be for a review session.
- Final Trivia!
You need to choose a topic for Homework 6
- Remember that this homework cannot be dropped.
- All tasks have the same difficulty.
- You will only be competing with people that choose your same dataset.
Where we've been...
Talking about bias vs variance trade-off.
Linear models, model selection and regularization:
- Linear regressions.
- Stepwise selection.
- Ridge and Lasso regression.

... and where we're going.

Continue on our prediction journey:
Decision Trees: Classification and Regression Trees (CART)
Activity in R: Remember to try to complete it before the end of the class!
Before we start... knowledge check!
Ridge and lasso regression add bias to a linear model to reduce variance:
- Remember that when we fit a ridge or lasso regression, we use all the predictors we have in our data!
Before we start... knowledge check!
Ridge and lasso regression add bias to a linear model to reduce variance:
- Remember that when we fit a ridge or lasso regression, we use all the predictors we have in our data!
λ represents the ridge/lasso penalty: The larger the λ the smaller the (sum of) coefficients, e.g. ∑kβ2k or ∑k|βk|.
- We "mute" or decrease the relation between predictors and outcome.
- We "mute" or decrease the relation between predictors and outcome.
Q1: What is the main difference (in terms of the final model) between Ridge and Lasso regression?
Trees, trees everywhere!
From the videos/readings, how would you explain to someone what a decision tree is?
Idea behind Decision Trees
Create a flow chart for making decisions
- How do we classify an individual or what value do we assign to an observation?
Idea behind Decision Trees
Create a flow chart for making decisions
- How do we classify an individual or what value do we assign to an observation?
... But there are many decisions!
Idea behind Decision Trees
Create a flow chart for making decisions
- How do we classify an individual or what value do we assign to an observation?
... But there are many decisions!
- How many variables do we use?
Idea behind Decision Trees
Create a flow chart for making decisions
- How do we classify an individual or what value do we assign to an observation?
... But there are many decisions!
How many variables do we use?
How do we sort them? In what order do we place them?
Idea behind Decision Trees
Create a flow chart for making decisions
- How do we classify an individual or what value do we assign to an observation?
... But there are many decisions!
How many variables do we use?
How do we sort them? In what order do we place them?
How do we split them?
Idea behind Decision Trees
Create a flow chart for making decisions
- How do we classify an individual or what value do we assign to an observation?
... But there are many decisions!
How many variables do we use?
How do we sort them? In what order do we place them?
How do we split them?
How deep do we go?
Q2: What is the main disadvantage of a shallower tree (compared to a deeper tree)?
a) Higher variance
b) Higher bias
c) Lower variance
d) Lower bias
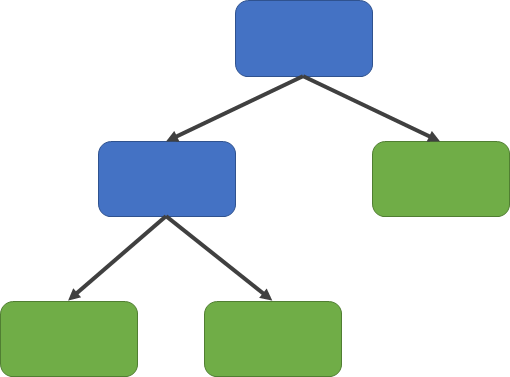
Structure of Decision Trees

Structure:
- Root node
- Internal nodes
- Leaves
Why do we like/not like Decision Trees?
Main advantages
Simple interpretation
Mirror human decision-making
Graphic displays!
Handle categorical variables
Main disadvantages
Overfitting
Not very accurate/not very robust
Let's start with a simple example
Remember our Hbo Max example?
Let's start with a simple example
Remember our Hbo Max example?
Predict who will cancel their subscription
Let's start with a simple example
Remember our Hbo Max example?
Predict who will cancel their subscription
We have some information:
city: Whether the customer lives in a big city or notfemale: Whether the customer is female or notage: Customer's age (in years)logins: Number of logins to the platform in the past week.succession: Whether the person has watched the Succession or not.unsubscribe: Whether they canceled their subscription or not.
The prediction task: Classification
- Our outcome is binary, so this is a classification task.
The prediction task: Classification
Our outcome is binary, so this is a classification task.
Let's start looking at two variables:
City & Succession
The prediction task: Classification
Our outcome is binary, so this is a classification task.
Let's start looking at two variables:
City & Succession
- Which one do you think should be at the top of the tree?
How do we decide?
Recursive Binary Splitting:
Divide regions of covariates in two (recursively).
This works both for continuous and categorical/binary variables
How do we decide?
Recursive Binary Splitting:
Divide regions of covariates in two (recursively).
This works both for continuous and categorical/binary variables
We test out every covariate and see which one reduces the error the most in our predictions
In regression tasks, we can use RMSE.
In classification tasks, we can use accuracy/classification error rate, Gini Index, or entropy
G=1∑k=0^pmk(1−^pmk) where ^pmk is the proportion of obs. in the m region for class k.
How do we decide?
In our HBO Max example:
- k represents the different values that the outcome can take (e.g. Unsubscribe∈{0,1}), and
- m represents the values that the predictor takes (e.g. Succession=0).
E.g.:
- pmk=p00: The proportion of people who are subscribed (Unsubscribed = 0) and that have not watched Succession (Succession = 0)
- pmk=p01: The proportion of people who are unsubscribed (Unsubscribed = 1) and that have not watched Succession (Succession = 0)
- Usually, you want the Gini index to be small!
Q3: According to the Gini Index, is it better or worse to have a high pmk (i.e. closer to 1)?
G=K∑k=1^pmk(1−^pmk)
Choosing predictors
- From the previous exercise, we can see that using
successionyields a lower Gini compared tocity(0.428 vs. 0.482)
Choosing predictors
- From the previous exercise, we can see that using
successionyields a lower Gini compared tocity(0.428 vs. 0.482)
But we have more variables
Choosing predictors
- From the previous exercise, we can see that using
successionyields a lower Gini compared tocity(0.428 vs. 0.482)
But we have more variables
How do we choose?
Basic Algorithm
1) Start at the root node
Basic Algorithm
1) Start at the root node
2) Split the parent node at covariate xi to minimize the sum of child node impurities
Basic Algorithm
1) Start at the root node
2) Split the parent node at covariate xi to minimize the sum of child node impurities
3) Stop if leaves are pure or early stopping criteria is satisfied, else repeat step (1) and (2) for each new child nodes
Basic Algorithm
1) Start at the root node
2) Split the parent node at covariate xi to minimize the sum of child node impurities
3) Stop if leaves are pure or early stopping criteria is satisfied, else repeat step (1) and (2) for each new child nodes
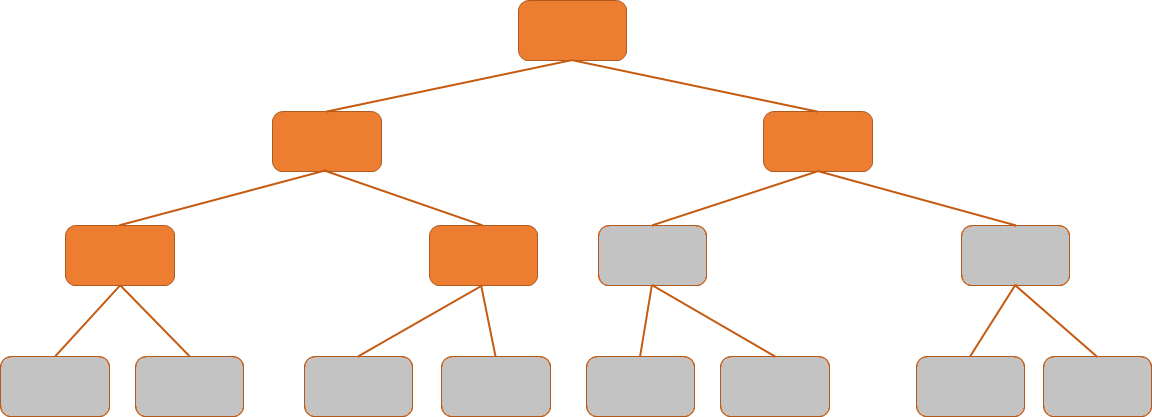
4) Prune your tree according to a complexity parameter (cp)
5) Assign the average outcome (regression) or the majority (classification) in each leaf.
Adapted from "Machine Learning FAQs" (Raschka, 2021)
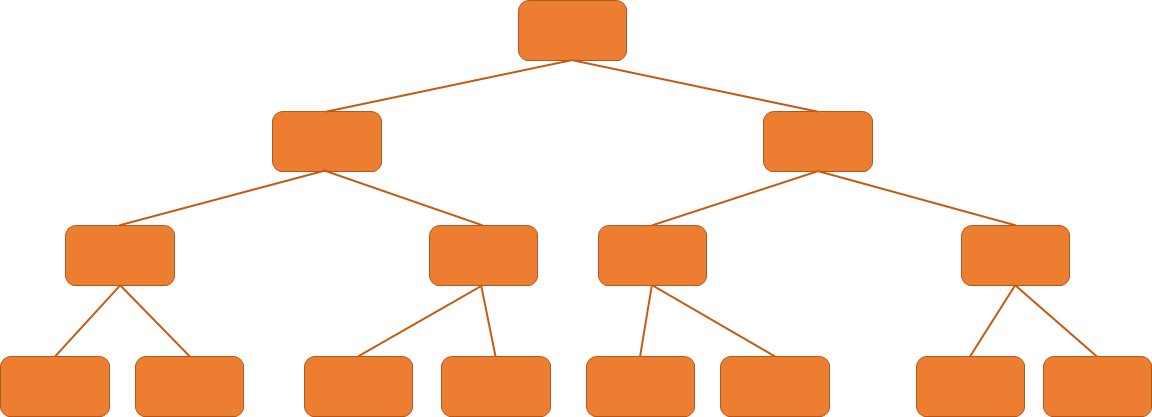
Grow full tree and prune it

Hyper-parameter: Complexity parameter
- Measure of how much a split should improve prediction for it to be worth it.
Hyper-parameter: Complexity parameter
- Measure of how much a split should improve prediction for it to be worth it.
|T|∑m=1∑i:i∈Rm(yi−^yi)2+α|T|
- |T|: Number of terminal nodes or leaves (e.g. size of the tree)
- Rm: Predictor space of the mth leaf
- α: Tuning parameter
Hyper-parameter: Complexity parameter
- Measure of how much a split should improve prediction for it to be worth it.
|T|∑m=1∑i:i∈Rm(yi−^yi)2+α|T|
- |T|: Number of terminal nodes or leaves (e.g. size of the tree)
- Rm: Predictor space of the mth leaf
- α: Tuning parameter
What happens if α=0?
Only attempt a split if it's worth it

Let's see how to do it in R!
library(caret)set.seed(100)ct = train( factor(unsubscribe) ~ . - id, data = hbo.train, #remember your outcome needs to be a factor! method = "rpart", # The method is called rpart trControl = trainControl("cv", number = 10), tuneLength = 15)Let's see how to do it in R!
library(caret)set.seed(100)ct = train( factor(unsubscribe) ~ . - id, data = hbo.train, #remember your outcome needs to be a factor! method = "rpart", trControl = trainControl("cv", number = 10), tuneLength = 15)Let's see how to do it in R!
library(caret)set.seed(100)ct = train( factor(unsubscribe) ~ . - id, data = hbo.train, #remember your outcome needs to be a factor! method = "rpart", trControl = trainControl("cv", number = 10), tuneLength = 15)tuneLengthis useful when you don't want to pass a specific grid (usually it might not be enough though!)
We could also provide a grid of complexity parameters
library(rpart)set.seed(100)ct = train( factor(unsubscribe) ~ . - id, data = hbo.train, method = "rpart", trControl = trainControl("cv", number = 10), tuneGrid = expand.grid(cp = seq(0,1, by = 0.01)), control = rpart.control(minsplit = 20))cp: Complexity parameterSplit must decrease the overall lack of fit by a factor of
cp, or is not attempted.Parameter for pruning the tree.
Higher
cp, smaller the tree!
minsplit: Min. number of obs in a node to attempt a split.
This works similarly to the penalty term in regularization...
plot(ct)ct$bestTune## cp## 4 0.03... And we can also plot the tree!
library(rattle)fancyRpartPlot(ct$finalModel, caption = "Classification tree for Unsubscribe")
What do you think the percentages in the leaves represent?
Regression Trees
Regression Trees
- Outcome is continuous
Regression Trees
Outcome is continuous
Very similar to what we have seen with classification trees:
- Predicted outcome is the mean outcome for the leaf/region.
In R is basically the same
set.seed(100)rt = train( logins ~. - unsubscribe - id, data = hbo.train, method = "rpart", trControl = trainControl("cv", number = 10), tuneLength = 20 )plot(rt)Providing a specific grid for cp
set.seed(100)tuneGrid = expand.grid(cp = seq(0, 0.1, by = 0.005))rt = train( logins ~. - unsubscribe - id, data = hbo.train, method = "rpart", trControl = trainControl("cv", number = 10), tuneGrid = tuneGrid )plot(rt)Plot the tree
fancyRpartPlot(rt$finalModel, caption="Regression Tree for Login")rt$finalModel## n= 5000 ## ## node), split, n, deviance, yval## * denotes terminal node## ## 1) root 5000 66387.3700 4.806800 ## 2) succession>=0.5 3535 24633.5000 2.973409 ## 4) city< 0.5 500 517.1580 0.322000 *## 5) city>=0.5 3035 20022.2800 3.410214 *## 3) succession< 0.5 1465 1200.0180 9.230717 ## 6) city< 0.5 212 132.2028 8.061321 *## 7) city>=0.5 1253 728.8571 9.428571 *Q4: What would the predicted value be for a customer who hasn't watched Succession and lives in a city?
fancyRpartPlot(rt$finalModel, caption="Regression Tree for Login")rt$finalModel## n= 5000 ## ## node), split, n, deviance, yval## * denotes terminal node## ## 1) root 5000 66387.3700 4.806800 ## 2) succession>=0.5 3535 24633.5000 2.973409 ## 4) city< 0.5 500 517.1580 0.322000 *## 5) city>=0.5 3035 20022.2800 3.410214 *## 3) succession< 0.5 1465 1200.0180 9.230717 ## 6) city< 0.5 212 132.2028 8.061321 *## 7) city>=0.5 1253 728.8571 9.428571 *Main takeaways of decision trees

Main advantages:
Easy to interpret and explain (you can plot them!)
Mirrors human decision-making.
Can handle qualitative predictors (without need for dummies).
Main disadvantages:
Accuracy not as high as other methods
Very sensitive to training data (e.g. overfitting)
Next class
Use of decision trees as building blocks for more powerful prediction methods!
Bagging
Random Forests
Boosting

References
James, G. et al. (2021). "Introduction to Statistical Learning with Applications in R". Springer. Chapter 8
Starmer, J.. (2018). "Decision Trees". Video materials from StatQuest (YouTube).
STDHA. (2018). "CART Model: Decision Tree Essentials"